Measuring the ROI of an OOH campaign in Indonesia is decided before the creative goes live. Screens, billboards and bus wraps produce no clicks, so a credible return figure depends on three things you set up in advance: a pre-campaign baseline, a comparable area that does not see the media, and a separate attribution marker for each medium and each site. Skip them and the wrap-up report usually ends with proof-of-play photos and a vague line about awareness.
What follows is the measurement framework we use when a brief combines LED videotron, static billboards, Transjabodetabek bus media, on-ground activation and social, written for regional brand teams and agencies who need numbers their finance colleagues will accept.
Agree on which return you are counting
OOH ROI is rarely a single figure. A packaged-goods brand sold through minimarkets, an app chasing installs and a car dealer waiting for test-drive bookings have very different conversion paths. Choose one primary metric that sits closest to revenue, then two or three supporting metrics that explain why the primary one moved.
| Campaign goal | Primary metric | Data source |
|---|---|---|
| Retail sales | Store sales near the sites vs a control area | Distributor or retail partner POS data |
| App installs or sign-ups | Installs and registrations by city, referral code per site | App analytics, mobile measurement partner |
| Outlet or showroom visits | Visit counts and "where did you hear about us" answers | Guest books, dealer CRM, cashier prompts |
| Product launch | Search volume for the product name, brand lift | Google Trends, pre/post survey |
Put the chosen metric in the media brief before sites are shortlisted. Site selection, flight length and creative all change depending on whether the goal is footfall to outlets or national brand lift.
Measuring OOH campaign ROI with a baseline and a control market
Sales during the flight mean little without something to compare them against. Pull at least four to eight weeks of pre-campaign data as a baseline, and pick a control area that resembles the test area but will not be exposed.
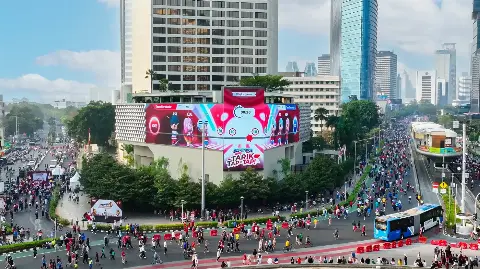
A simple design we often sketch for clients: run the creative in Bandung on LED Buah Batu A, which faces traffic heading to the Padalarang toll road, LED Buah Batu B, which faces central Bandung, and LED Sunda, oriented toward BIP. Keep Bogor as the control city over the same weeks. The result you report is Bandung's growth minus Bogor's growth, not Bandung's uplift on its own. If Bogor also rises because of payday or school holidays, that share of the increase did not come from the screens.
This only works with discipline. Avoid running a deep discount, a marketplace promotion or a TV burst in the test city alone, or the effects can no longer be separated. If other activity has to run, run it evenly in both markets.
Attribution markers by media type
Each format leaves a different kind of trace. The rule stays the same: one site, one marker, so its contribution can be isolated.
LED videotron
Digital screens make measurement easier in two ways. Airtime is logged by slot, so you can line up broadcast hours with hourly transaction data from nearby stores. And because creative can be swapped without reprinting, two message versions can be rotated and compared.
Use double-sided locations to your advantage. LED Mega Anggrek on Jl. Arjuna Selatan in West Jakarta has Side A (9 x 18 m) facing traffic toward Tangerang and Side B (9 x 18 m) facing toward Semanggi. Give each side its own QR or promo code and you learn which traffic flow responds better. The same split works between LED Senopati (8 x 4 m, facing SCBD) and LED Slipi (9 x 18 m, facing Semanggi) when both sit in one package.
A practical caveat: QR codes on roadside screens only work for passengers, pedestrians and drivers stopped at a light. For people behind the wheel, a short code or a promo name that is easy to type later is more realistic.
Static billboards
A billboard runs one execution for the whole contract, so tag it with a short URL or a unique code per site. One code for Billboard PGC, facing Jl. Raya Bogor toward Cililitan, and another for Billboard TB Simatupang, facing toward Lebak Bulus, is enough to compare sites. Redemptions will be a small slice of everyone who saw the board, which is fine: the code exists to rank sites against each other.
Transjabodetabek buses
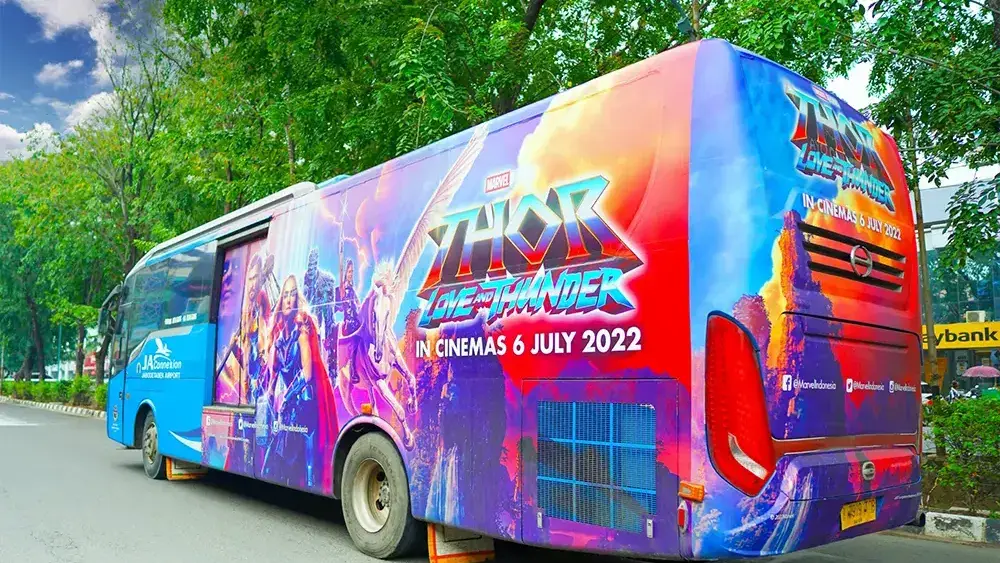
Buses move, so attribution per vehicle is close to impossible. Measure at corridor level instead: compare brand search and sales in the commuter towns the routes serve against towns they do not. Route details are on our transit media page.
On-ground activation and creative branding
This is where data is easiest to collect, because people interact directly. Themed bus shelters, booths and interactive installations can log participants, voucher redemptions and sign-ups. Under Indonesia's Personal Data Protection Law (UU PDP), personal data needs clear consent and a stated purpose, and it is better held by the brand than by the vendor.
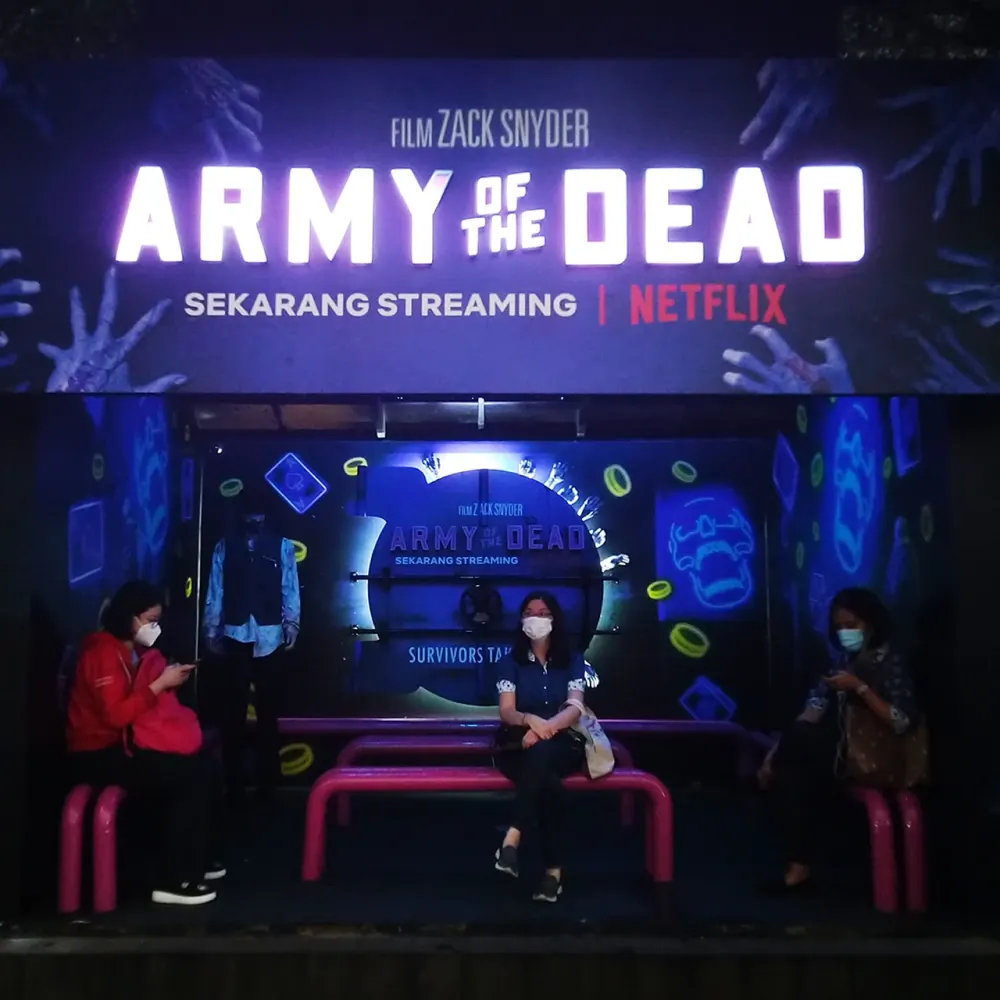
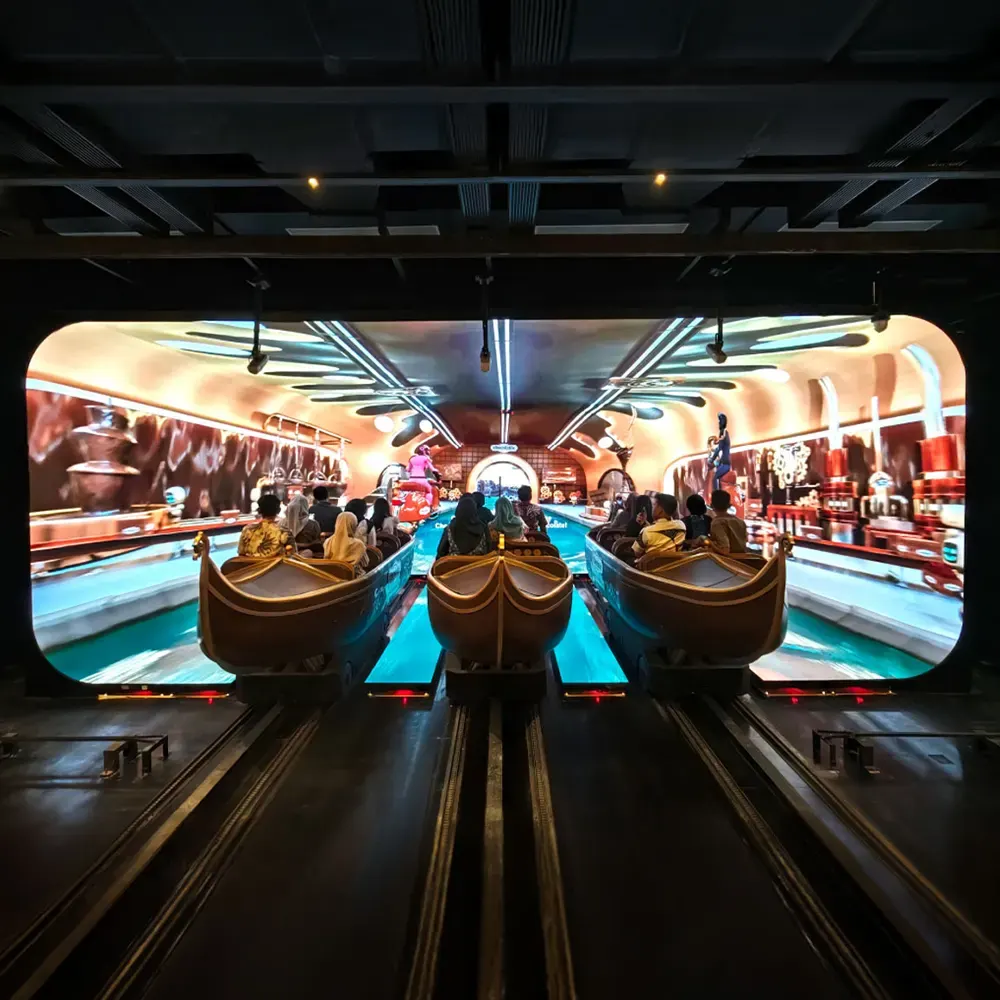
For digital installations, design the mechanic so that every session produces one data point: a game score, a shared photo or a voucher scanned at the till. Activation-specific metrics such as stop rate and dwell time are covered in our piece on measuring brand activation success.
Connecting outdoor to social and search
Integration is what makes OOH countable. Three digital signals usually move when outdoor media is doing its job.
- Branded search: track Google Trends and Search Console for brand and product names, split by city, starting from the baseline period.
- Social conversation: count mentions, posts using the campaign hashtag and photos that show your sites. Landmark locations such as the three-sided robotic LED at LED Mandarin, Bundaran HI, are more likely to be photographed and posted, so creative there deserves a hashtag people can remember.
- Location-based retargeting: run geofenced social ads around the screen locations and compare CTR and cost per result with audiences outside that radius.
None of these prove sales on their own. They help explain the chain of cause and effect when the primary metric rises in the test market.
Calculating the ROI figure and its cost base
The core formula: ROI = (incremental gross profit - total campaign cost) / total campaign cost. Incremental is the operative word, meaning the difference against the control area rather than total sales during the flight. Gross profit is not revenue either; use the margin your finance team signs off.
The cost line has to be complete: media rental, video and print production, installation, local advertising tax and permits, activation crew and equipment, prizes or vouchers, and the supporting social spend. Plenty of reports look strong only because they count media rental alone. Advertising tax and permit costs vary by city and format in Indonesia, so ask the media owner to break them down per site when the quote is prepared.
For campaigns built around brand lift, report cost per point of awareness gained or per unit of search uplift instead of a rupiah ROI. Forcing a revenue figure onto an awareness objective tends to cost the report its credibility with management.
Mistakes that break the measurement
Short flights are the most common problem we see. A one-week burst rarely produces a difference you can separate from normal noise. For sales measurement, plan at least four weeks on air plus two to four weeks of observation afterwards, because outdoor effects often lag.
The next is changing too many variables at once: new sites, new pricing and new packaging in the same month. Decide what is being tested. Seasonality matters too. A year-end campaign running from 12.12 through New Year's Eve sits on top of a natural shopping spike, which makes the control market even more important. We cover that calendar in planning a year-end advertising campaign in Jakarta.
Finally, avoid judging a site purely by code redemptions. Billboard Lebak Bulus might show few redeemed codes while still lifting search and sales in the surrounding area. Codes are for comparison, not for capturing a site's whole contribution.
Paperwork to request from your media owner
Measurement is only as solid as the proof that the media ran. Ask for slot-level airtime schedules for screens, dated photo or video documentation of playback, installation photos for billboards and buses, and daily activity reports for activations. Check that the creative on air matches the version logged, especially when you are testing two messages. All of this then goes into one weekly sheet alongside your sales and digital data.
What to send us first
Before you get in touch, have three things ready: the primary metric your finance team will use, whatever baseline data you already hold by city, and the campaign window. With those, our team can propose a site mix from our media inventory, a test and control market pair, and an attribution marker for every site. Message us on WhatsApp at +6282288108888 for site recommendations and a quote built around your measurement plan.