To measure brand activation success in Jakarta, decide what the activation is for before anyone designs the booth, pick two or three numbers that prove it, and plan how staff or software will capture those numbers on site. Teams that think about measurement after the event usually come back with crowd photos and a rough headcount, and that does not survive a budget review with a regional office.
The timing matters this month. October is when many brands lock in year-end mall and public-space activations in Jakarta while drafting 2027 plans. A clean report from this quarter is the strongest argument you will have for repeating, resizing or dropping a format next year.
Start with one objective and one primary KPI
A single activation rarely wins on every metric. A fast sampling booth placed on an after-office walking route will collect few customer records, because people will not stop for long. A touchscreen game that takes three minutes per player creates deep engagement but caps how many people take part each hour. So the objective comes first and the KPIs follow from it.
| Objective | Primary KPI | How to capture it on site |
|---|---|---|
| Launch awareness | People who stop and watch the demo | Hourly clicker counts, sampled at peak and off-peak |
| Trial or sampling | Samples actually consumed on site | Opening stock minus closing stock, cross-checked with staff counts |
| First-party data | Valid records with opt-in consent | Digital form with a consent checkbox and number or email verification |
| Sales | Transactions using an activation-only code | Voucher or promo code unique to the venue and date |
| Social content | Posts using the campaign hashtag or tagging the brand | Hashtag monitoring during the event and for seven days after |
Secondary numbers are still worth logging. Agree in writing which one decides whether the activation worked, or every stakeholder will pick the figure that flatters their part of the plan.
How to measure brand activation success on the ground
We split on-site measurement into three layers. Each answers a different question, and each needs the same method from the first day to the last.
Layer one: passers-by versus people who stop
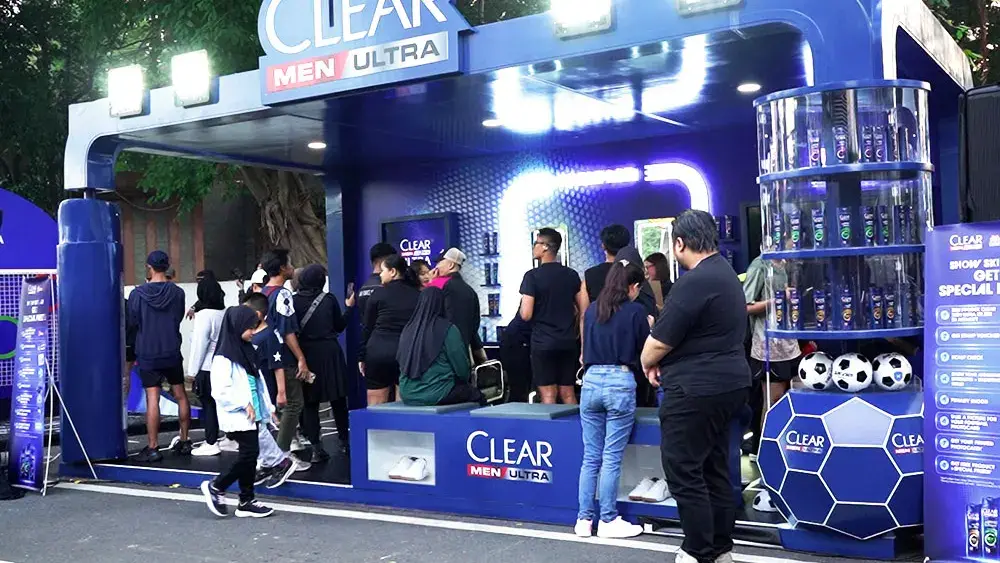
Foot traffic past the booth is your denominator; people who stop are the numerator. The ratio, usually called the stop rate, tells you whether the booth design, position and visual hook are doing their job. The leanest method is one staff member with a clicker for 15 minutes every hour, logging passers-by and anyone who pauses for more than a few seconds. Some Jakarta mall operators keep door or floor counter data, so ask during venue negotiation whether they will share it.
A low stop rate in a busy corridor points to the booth: an unclear entry, or a queue that looks too long. A high stop rate in a quiet corner means the format works and the location does not. Those diagnoses call for very different fixes.
Layer two: depth of interaction
Once people stop, record what they do. For a photobooth, count sessions and how many images were sent to visitors' phones. For a game, count completed plays rather than started ones. For a product demo, track average dwell time. Completions are the more honest figure, because people who walk off halfway rarely leave with the brand message.
Layer three: what remains after visitors leave
This is where an activation proves its value: consented customer records, vouchers redeemed within 14 days, new followers during the event window, or sales at nearby outlets against a prior period. Choose the one closest to your objective. For any data capture in Indonesia, collect explicit consent and explain how the data will be used, in line with the Personal Data Protection Law (UU PDP). Records without documented consent are a legal exposure and cannot feed a follow-up campaign.
Digital activations are easier to measure if logging is specified early
On-ground digital activity formats such as touchscreen games, interactive floors, AR and digital photobooths can log every session automatically. The catch is that logging has to be written into the build brief. Ask for it on event day and the app is usually locked and stores nothing.
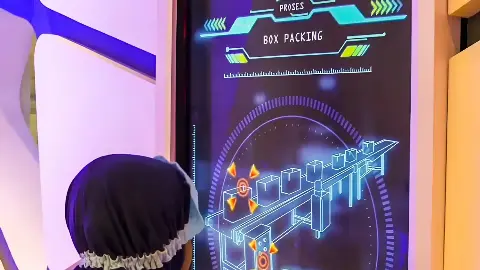
For reference, the Garudafood Chocolatos X-Quest on-ground digital activity we delivered combined a ride-style experience with LED screens wrapping around visitors, Garudafood Gery X-Quest used a VR train ride, and Bintang Toedjoe ran a football game projected onto an interactive floor. Formats like these can record sessions, play time and completion rates by the hour, provided those requirements sit in the technical brief from day one.
When briefing the production team, ask specifically for a timestamp per session, a completed or abandoned flag, the opt-in count, the number of photos or videos shared, and a daily spreadsheet export. Those five items are enough for a report your finance team can read without a walkthrough. If the activation relies on game mechanics, our piece on brand activation gamification in Jakarta covers how to set play length and prizes so the queue keeps moving.
Separating the lift from LED screens and social media
When an activation is supported by nearby out-of-home media, measure in a way that isolates each channel. A simple setup: an activation at Agora Lifestyle Mall in Tanah Abang can be supported by the LED Agora M & L1 screens (19.84 x 2.56 m and 20.8 x 1.6 m) and the LED Agora Skydeck (4 x 7 m) inside the same mall. Compare the booth's stop rate during hours when the activation content plays against hours when it does not. It is a rough method, yet it shows direction.
For a weekend activation near Bundaran HI, the robotic LED at LED Mandarin, with three sides facing the roundabout, works as a landmark for people arriving from different directions. Along the Sudirman corridor, LED Dukuh Atas (7 x 14 m, facing Jl. Jend. Sudirman toward Senayan) can remind drivers that an event is running nearby. In both cases, give each medium its own QR code or hashtag so you can trace where visitors came from. A QR code on a large roadside screen only works if it is big enough and viewers have time to scan, so match it to viewing distance and traffic speed at that site.
Mistakes that make an activation report unusable
Plenty of activations run well and still end with a report nobody trusts, because the data cannot be compared or verified. The usual causes:
- No baseline. Without normal-day foot traffic or a previous activation to compare against, any number lacks context.
- Counting the same person several times. A visitor who plays three rounds becomes three participants, inflating reach.
- Staff, brand team members and their families counted as visitors, especially on opening day.
- Measuring only day one or the weekend, then multiplying across the full run.
- Collecting personal data without recorded consent, which makes the database unusable.
One page of counting procedures, handed to every crew member before doors open, prevents all of these.
A post-event report your next budget can use
A useful report is a few pages long. Page one states the objective, the agreed KPI and the result in a single table. The next pages break results down by day and by hour, because that is where you see which time slots deserve the budget next time. Include photos of the booth at peak and quiet hours, not just the best shot.
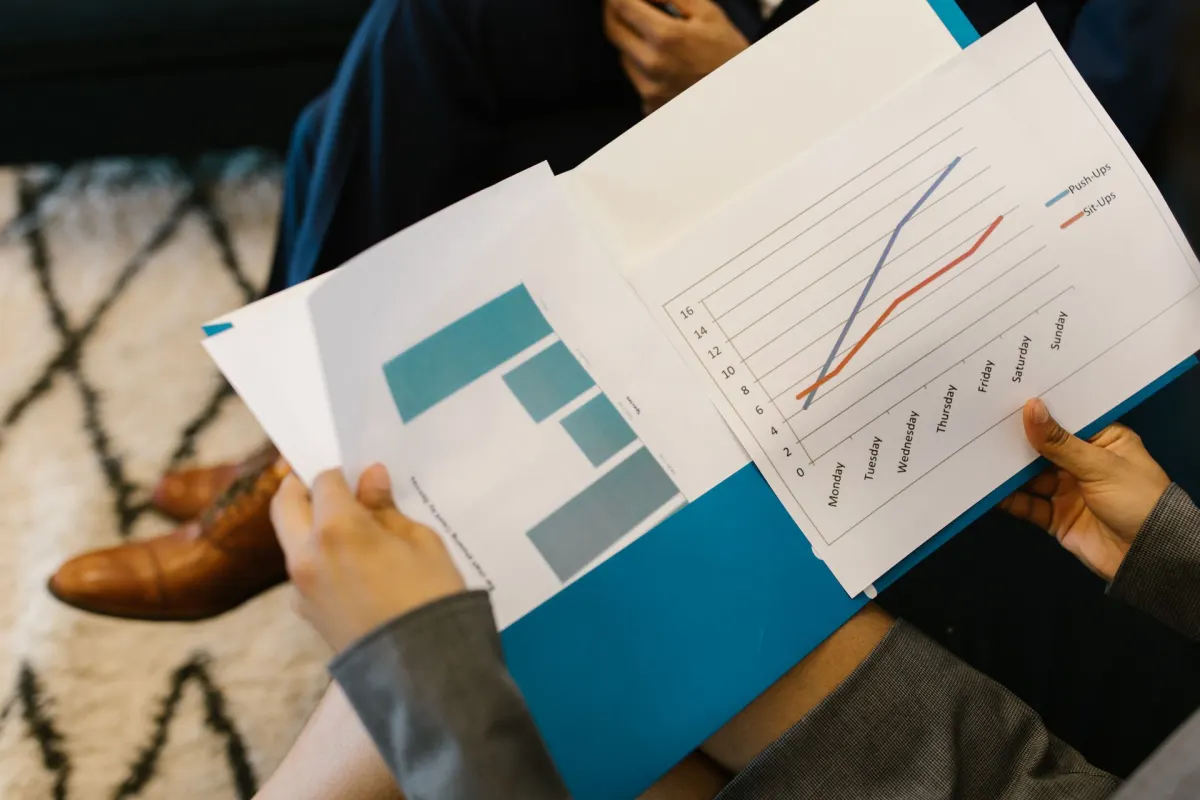
Close with findings someone can act on: a booth position to shift, a game that runs too long, gaps in staffing at certain hours, or a support medium that showed no visible effect. That section is what makes the report worth reading when next year's plan is drafted.
What drives the cost of measurement
Good measurement needs resources and belongs in the budget from the start. The main factors are the number of days and hours to be logged, extra counting staff, building logging features into an interactive app, voucher or unique-code systems, and how long social monitoring runs after the event. Static on-ground creative branding usually needs manual counts only, while digital formats can draw on their own system data.
Next step
If you are planning a year-end or Q1 2027 activation in Jakarta, Bandung, Bogor or Bekasi, send us three things: the primary objective, the target city or venue, and the date range. We will come back with a format, supporting media sites and a measurement plan in one proposal. Reach the team on WhatsApp at +6282288108888 or through the contact page for site recommendations and a quote.